Design Problems of Rescue-Radar
I.A. Vyzmitinov Ph. D.,
Ye.I. Myroshnychenko Ph. D., O.V. Sytnik D. Sci., Y.A.
Kopylov
A. Usikov Institute
for Radiophysics and Electronics National Academy of
Sciences of Ukraine, 12, Ak. Proskura, Kharkov, Ukraine,
61085
E-mail: ssvp11@ire.kharkov.ua
; vigor@ire.kharkov.ua
1. Introduction.
In
man-caused catastrophes it is necessary to quickly detect the
survivals among bricks or broken concrete slabs. The process
of heartbeat, breathing and motion of human bodies is the
distinctive sign of a living man. Selecting these signs is
made possible by the Doppler analysis of radar echo signals.
The level of the signals reflected from a targets is very low
- (140.100) dB. Noises and coherent radar clutters result from
the sounding signals reflection from walls, trees, human
beings, cars etc.
The basic products
of rescue-radars development are:
a)
video pulse radars [1 - 7];
b)
continuous-signal radars [8, 14, 15].
For
continuous-signal radars is important to choose a signal,
whose ambiguity function [9] would be near to the pencil (push-button)
type. The level of side lobe of such a function must not
exceed ‑ (100…70) dB. Phase ‑ coded manipulated
signals [10, 14] at
 have
the side lobes below ‑ 80 dB. The depth of signal
penetration
have
the side lobes below ‑ 80 dB. The depth of signal
penetration
 of
in the bricks and concrete walls in accordance with
of
in the bricks and concrete walls in accordance with
 is
directly proportional to the sounding signal wavelength. Under
real condition the signal propagation environment is not
homogeneous, since it may coming of wreckage, debris of broken
concrete slabs etc. For example, 1 GHz signal propagating
through a concrete wall 1 m thick decreases its energy by
40 dB. The losses of a 10 GHz signal are reducing by nearly 90
dB. Thus, the higher is the signal frequency, the easier is
the signal penetration through metallic frames. And the lower
is the signal frequency, the easier is it’s the signal
penetration into the barriers. The optimum sounding signal
frequency is within the limits of (1…2,5) GHz. The signal
polarization must be circular for the increase the probability
of penetration of sounding signal into the barriers.
is
directly proportional to the sounding signal wavelength. Under
real condition the signal propagation environment is not
homogeneous, since it may coming of wreckage, debris of broken
concrete slabs etc. For example, 1 GHz signal propagating
through a concrete wall 1 m thick decreases its energy by
40 dB. The losses of a 10 GHz signal are reducing by nearly 90
dB. Thus, the higher is the signal frequency, the easier is
the signal penetration through metallic frames. And the lower
is the signal frequency, the easier is it’s the signal
penetration into the barriers. The optimum sounding signal
frequency is within the limits of (1…2,5) GHz. The signal
polarization must be circular for the increase the probability
of penetration of sounding signal into the barriers.
The
radiation power should exceed the receiver’s proper noise by
10 to 20 dB. Therefore the radar power is chosen from 100 to
150 mW with a receiver sensitivity of ‑ 170 dBW.
2.
Block diagram of rescue-radar.
The
generalized block diagram
of the portable rescue-radar is shown in Fig. 1.
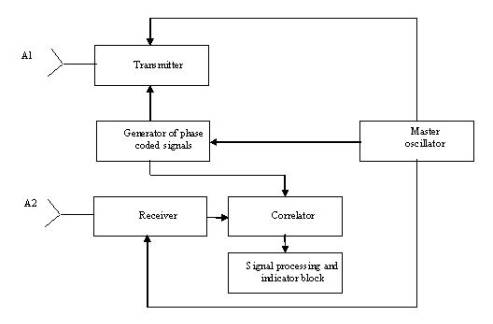
Fig.1 Generalized
rescue-radar block diagram
The distinctive feature
of the radar with a pseudorandom sounding signal is the need
to form coherent modulating functions for the
transmit-and-receive channels. Therefore a general high
stability master oscillator
with a relative instability of signal frequency
 at
a carrier frequency of 2 GHz is the basic element of the block
diagram. From a signal of the master oscillator are formed:
carrying signal of the transmitter; a basic signal heterodyne
oscillator to the receiver; basic signal for the modulator;
clock signals for the block of processing. The frequencies of
all signals are generated either by division or multiplication
of the master oscillator frequency. The automatic frequency
control is not employed. In Fig. 2 the complete rescue-radar
block diagram is shown. Radar is operated as follows. The
output signal of master oscillator 1
simultaneously is fed to amplitude modulator 2
and two frequency dividers 3
and 4 with the division factors
at
a carrier frequency of 2 GHz is the basic element of the block
diagram. From a signal of the master oscillator are formed:
carrying signal of the transmitter; a basic signal heterodyne
oscillator to the receiver; basic signal for the modulator;
clock signals for the block of processing. The frequencies of
all signals are generated either by division or multiplication
of the master oscillator frequency. The automatic frequency
control is not employed. In Fig. 2 the complete rescue-radar
block diagram is shown. Radar is operated as follows. The
output signal of master oscillator 1
simultaneously is fed to amplitude modulator 2
and two frequency dividers 3
and 4 with the division factors
 20 and
 10
respectively. At the
other input of amplitude modulator 2
the 100 MHz
oscillations are set up from divider 3.
Narrow-band filters 8,
9 are connected to the output of modulator 2
serve to sort out oscillations of upper sideband (filter 8)
and lower side band (filter 9).
Separations of coherent oscillations frequencies at the
outputs of filters 8 and
9 are 200 MHz. The upper sideband
oscillations of are used in the
radars transmitter to generate the sounding signal, and the
lower side band oscillations are used to generate for the
receivers heterodyne. A sounding signal in balanced modulator 7
is increased by amplifier 6
to the value -10 dBW and radiated by transmitting antenna 5
in space. The pseudorandom modulating function generated
in block 10 has
effected upon the other input of balanced modulator 7.
The clock rate of the reference oscillator is generated
from 1 by dividing the frequency in block 3. The pseudorandom function is generated in block 10
by a numerical procedure. The subcarrier frequency is 1,3
kHz. The subcarrier oscillation period is made equal to two
periods of pseudorandom signal. Upon multiplying the required
delays of the pseudorandom signal are formed in block 11 for range target selection. The receiver heterodyne signal
appears at the balanced modulator 12
output. The coherent transmitter signal and pseudorandom
signal are fed to the inputs of block 12
from filter 9 and
block 10. The signals from the output of antenna 14 and amplified by amplifier 15,
with a noise factor of 2 dB and amplifying factor of 10 to
15 dB are fed to
the first input of balanced mixer 16
while the heterodyne signal from block 13
is fed to the second input of block 16
(correlator). Bandpass filter 17
is connected to the output of mixer 16.
From the output of block 17
the signal at the intermediate frequency of 200 MHz is fed to
two quadrature channels 18,
19. The information signal is
transferred to a subcarrier frequency of 1,3 kHz in
balanced mixers 20 of
each channel. The quadrature signals are separated in each
channel by means of phase shifter 27.
These signals are filtered in bandpass filters 21
and amplified in narrow-band low-frequency amplifiers 22. These signals are then squared in blocks 23 and added
in block 24. The
decision-making concerning the presence or absence of a target
is accomplished by block 26.
10
respectively. At the
other input of amplitude modulator 2
the 100 MHz
oscillations are set up from divider 3.
Narrow-band filters 8,
9 are connected to the output of modulator 2
serve to sort out oscillations of upper sideband (filter 8)
and lower side band (filter 9).
Separations of coherent oscillations frequencies at the
outputs of filters 8 and
9 are 200 MHz. The upper sideband
oscillations of are used in the
radars transmitter to generate the sounding signal, and the
lower side band oscillations are used to generate for the
receivers heterodyne. A sounding signal in balanced modulator 7
is increased by amplifier 6
to the value -10 dBW and radiated by transmitting antenna 5
in space. The pseudorandom modulating function generated
in block 10 has
effected upon the other input of balanced modulator 7.
The clock rate of the reference oscillator is generated
from 1 by dividing the frequency in block 3. The pseudorandom function is generated in block 10
by a numerical procedure. The subcarrier frequency is 1,3
kHz. The subcarrier oscillation period is made equal to two
periods of pseudorandom signal. Upon multiplying the required
delays of the pseudorandom signal are formed in block 11 for range target selection. The receiver heterodyne signal
appears at the balanced modulator 12
output. The coherent transmitter signal and pseudorandom
signal are fed to the inputs of block 12
from filter 9 and
block 10. The signals from the output of antenna 14 and amplified by amplifier 15,
with a noise factor of 2 dB and amplifying factor of 10 to
15 dB are fed to
the first input of balanced mixer 16
while the heterodyne signal from block 13
is fed to the second input of block 16
(correlator). Bandpass filter 17
is connected to the output of mixer 16.
From the output of block 17
the signal at the intermediate frequency of 200 MHz is fed to
two quadrature channels 18,
19. The information signal is
transferred to a subcarrier frequency of 1,3 kHz in
balanced mixers 20 of
each channel. The quadrature signals are separated in each
channel by means of phase shifter 27.
These signals are filtered in bandpass filters 21
and amplified in narrow-band low-frequency amplifiers 22. These signals are then squared in blocks 23 and added
in block 24. The
decision-making concerning the presence or absence of a target
is accomplished by block 26.
3.
Signal processing.
The
multiplicative unstationary process model can be thought of as
some stochastic oscillations with the appropriate
probabilistic laws. And at the same time, these processes have
the saving properties of periodic repetition (heartbeat and
breathing). Therefore we will build the informative process
model at the Doppler radar output in terms of the class of
models with multiplicative unstationarity. One of the most
widespread methods of describing the multiplicative
unstationarity processes is presented by the correlation
function of the process of the form
 ,
(1)
,
(1)
where
 is
the correlation function of the stochastic process, that meets
the follow condition
is
the correlation function of the stochastic process, that meets
the follow condition
 (2)
(2)
With all
complex
 , where
 is
the complex plane, all
is
the complex plane, all
 , where
 is
the real axis, the symbol * denotes the complex
conjugation.
is
the real axis, the symbol * denotes the complex
conjugation.
It
is evident that if the assumption about the slowness of
function
 with
respect to
with
respect to
 hold
true, then an expression for the process dispersion can be
written as
hold
true, then an expression for the process dispersion can be
written as
 , 3)
, 3)
where
 and,
by definition, function
and,
by definition, function
 for
all
for
all
 .
.

Fig.1 Block scheme rescue-radar
Expression
(2) given the convenient description of the model for the
steady and multiplicative unsteady processes. Indeed, if
 , (3)
determines the dispersion of the stationary process. It is
obvious that the signals with correlation function of type (1)
is to not exist in nature. It is strongly indicative in [11].
In fact, condition (2) holds, when a correlation function
depends not only upon the specific values of
, (3)
determines the dispersion of the stationary process. It is
obvious that the signals with correlation function of type (1)
is to not exist in nature. It is strongly indicative in [11].
In fact, condition (2) holds, when a correlation function
depends not only upon the specific values of
 and
and
 but
upon their difference, i.e.
but
upon their difference, i.e.
 :
:
 . But in
this case the must be a symmetric in relation to (1)
correlation function
. But in
this case the must be a symmetric in relation to (1)
correlation function
 . It is
easy to show that for the process with involving the
correlation function (1) impossible the hermitian symmetry
condition, which consists of equality
. It is
easy to show that for the process with involving the
correlation function (1) impossible the hermitian symmetry
condition, which consists of equality
 . However,
at
. However,
at
 it
is implement this equality. Therefore multiplier
it
is implement this equality. Therefore multiplier
 in
expression for the correlation function of the real
informative process must depend not only on
in
expression for the correlation function of the real
informative process must depend not only on
 but
also upon
but
also upon
 , i.e.
 .
(4)
.
(4)
Model
(4) is the one with unshared variables. This feature is well
illustrated by experimental data. In Fig.3 the fragment of
correlation function model of the informative process of the
Doppler radar at the output normalized to the its maximum is
shown. This function is calculated in the interval of 10
second. This particular function is calculated from the echo
signal backscattered from a human thorax at a 2,5 m distance
to the target (the radar operating frequency is 1,8 GHz,
 ,
,
 -
is the wavelength,
-
is the wavelength,
 is
the aperture linear dimension).
is
the aperture linear dimension).
The
fragment of the correlation function of that process, which is
computed in the interval of 200 second is shown in Fig.4. The
obvious differences in these functions are evidenced by the
fact the variables in (4) are unshared. As well as for model
(1), it is possible to define dispersion for a model (4).
 ,
(5)
,
(5)
Comparing
correlation (5) and (3) it is possible to write
 , then
model (4) has the form as
, then
model (4) has the form as
 .
(6)
.
(6)
In
formula (6) both factors can now be expressed via one variable
which is linear combination of two initial variables. Thus,
(6) acquires a sufficiently clear physical meaning. So, the
first factor can be regarded as the process dispersion in the
middle of the time span between the two components, the
correlation linkage between them being determined by the
second factor. By replacing of variables
 ,
,
 we
again obtain process model with the shared variables
we
again obtain process model with the shared variables
 .
(7)
.
(7)
|
|
|
|
Fig.3.
Module of the correlation function calculated on the
10-second interval.
|
Fig.
4. Module of the correlation function calculated on the
200-second interval
|
However,
the complete consistence of theoretical model (1), i.e.
factorization of the correlation function here is not achieved.
Lets us enter displacement in time, i.e.
 .
(8)
.
(8)
It
is evident, that in this case both the periodogram and
correlogram spectral estimations of such processes will be
unstationary in time. Traditionally the instantaneous values
of spectral components of the informative process can be
represanted on an interval
 , by direct
Fourier-transformation
, by direct
Fourier-transformation
 ,
(9)
,
(9)
where
 is
the variable having with the time dimension;
is
the variable having with the time dimension;
 it
is the realization of the process being observed.
it
is the realization of the process being observed.
The
dependence of spectral model (5) upon the concrete moments of
time makes this model inadequate. However, if the correlation
function of the periodically correlated process [12] is used,
then it is possible to construct a spectral time-independent
model. Such a model is based on establishing the correlation
between the separate spectral components, the so-called
spectral-correlation function [13]
 ,
(10)
,
(10)
where
 is
the middle of frequency interval, and
is
the middle of frequency interval, and
 is
the frequency displacement with respect for
is
the frequency displacement with respect for
 .
.
The
module of the spectral-correlation function of the informative
process calculated above is shown in Fig. 5. As seen from
Fig.5 the components remaining from breathing (at a frequency
 Hz
and heartbeats at a frequency
Hz
and heartbeats at a frequency
 of
Hz) are clearly visible. For comparison the periodogram
spectral density of this informative process is presented in
Fig.6.
of
Hz) are clearly visible. For comparison the periodogram
spectral density of this informative process is presented in
Fig.6.
|
|
|
|
Fig.
5. Module of spectral-correlation function.
|
Fig.
6. Periodogram spectral density
|
4.
Conclusion.
Thus,
all the rescue radar signals must be absolutely coherent. In
signal processing it is impossible to employ model (4) with
incompletely shared variables. When synthesizing the
algorithms for detecting recognizing and identifying objects
it is necessary to make use of periodically correlated
processes model is preferred. The rescue radar parameters are
given in Table 1.
Table 1.
|
№
|
Qualitative
characteristics.
|
Value.
|
Notes.
|
|
1
|
Range.
|
1…2,5
GHz
|
|
|
2
|
Average power
|
>100…150,0 mW
|
It is
regulated depending on a local noises.
|
|
3
|
Receiver sensitivity
|
-170
dBW
|
At
maximum possible at the receiver band 10Hz.
|
|
4
|
Type of
radiation
|
Continuous
|
|
|
5
|
Modulation
|
Phase
manipulation by a code.
|
|
|
6
|
Width
of main antenna lobe of azimuth and elevation angle
plane
|
150-250
|
>
150
|
|
7
|
Range
resolution
|
1…2 m.
|
|
|
8
|
Range (to
the first barrier)
|
5…15 m.
|
|
|
9
|
Extent
of responsibility area after the first barrier
|
1,5…7m.
|
|
|
10
|
Doppler
filter band
|
0,1…5 Hz.
|
Depending
on nose
|
|
11
|
Side
lobe level of ambiguity function,
|
-80
дБ.
|
Number
of elements of pseudorandom signal
N= 215
– 1 or N=217- 1
|
|
12
|
Volume
|
8-10 dm3
|
|
|
13
|
Weight
with power supply unit
|
2…3 kg.
|
|
The external view of the rescue radar is shown in Fig.6.
Receive-ttansmitt antennas are incorporated in a single design.
All radar blocks are placed in separate screened cells in the
common design. The power supply
batteries are placed in a separate shockproof
bag. The power supply unit is coupled to the radar through a
separate cable.

Fig.6.
The external view of the rescue radar
5.
Literature.
1.Immoreev I.Ya.
Possibilities
and features of sverkhshyrokopolosnykh radyosystem
// Applied electronics,
Kharkov. ‑
2002. –V.1.‑ № 2.‑ P. 122-140. (in
Rus).
2.
Daniels D.J. Surface-penetrating radar. - RA 006, ISBN 0 85296
862 0, 1996, 300 p
3.
Ivashov S.I., Sablin V.N., Vasilyev I.A. Wide-Span Systems of
Mine Detection. – IEEE Aerospace & Electronic Systems
Magazine. May 1999, Vol. 14, No. 5, pp. 6-8.
4.
Ivashov S.I., Makarenkov V.I., Razevig V.V., Sablin V.N.,
Sheyko A.P., Vasiliev I.A. Remote Control Mine Detection
System with GPR and Metal Detector. - Proceedings of the Eight
International Conference on Ground Penetrating Radar,
GPR’2000, May 23-26, 2000, University of Queensland, Gold
Coast, Queensland, Australia, pp. 36-39.
5.
Ivashov, S.I., Isaenko V.N., Konstantinov V.F., Sablin, V.N.,
Sheyko, A.P., Vasiliev, I.A. GPR for Detection and Measurement
of Filled up Excavations for Forensic Applications. -
Proceedings of the Seventh International Conference on
Ground10 Penetrating Radar, GPR’98, May 27-30, 1998,
University of Kansas, Lawrence, Kansas, USA, V. 1, pp. 87-89.
6.
A.A.Vertiy, S.P.Gavrilov, I.V.Voynovskyy, V.N.Stepanyuk,
Sunullah Ozbek, “The Millimeter Wave Tomography Application
for the Subsurface Imaging”, International Journal of
Infrared and Millimeter Waves, vol. 23, No 10, 2002,
p.p.1413-1444.
7.
O. Salman, S. P. Gavrilov, A. A. Vertiy, “Subsurface
Microwave Imaging By Using Angular Part Of Scattered Field”,
Journal of Electromagnetic Wave and Applications, Vol.16, No.
11, 1511-1529,2002.
8.
Sytnik O.V., Myroshnichenko Ye.I., Kopylov Y.А.
Estimation of the influence of hardware inaccuracy on the
features of a radar for near target location // Radiophysics
and electronics. ¾
2002.¾V.7.
¾
№3. ¾
P.548¾554.
(in Rus).
9.
Woodward P.M. Probability and Information Theory with
Applications to Radar. Pergamon Press, N.Y.‑ 1953.
10.
Wilson R., Richter J. Generation and Performans of Quadraphase
Welty Codes for Radar and Synchronization of Coherent and
Differentially Coherent PSK. – IEEE Trans. Comm. – 1979.
– V. COM-27. ‑ №9. – P. 641 – 647.
11.
Loev M. Probability Theory
–Moscow. - 1962. ‑ 719 P.(in Rus).
12.
Dragan Ya.P. Energy Theory of Linear Models of stochasticе
signals. – Lviv, Centre
of Strategic Investigations of Eco-Bio-Technical Systems.
– 1997. – 333 с. (in Ukr)
13.
Gardner W.A. Spectral Correlation of Modulated Signals: Part I
– Analog Modulation. // IEEE Transactions on Communications.
– 1987. – COM-35, №6, - P. 584 – 594.
14.
Vyzmitinov I.А., Myroshnichenko Ye.I., Sytnik O.V. Questions
of surface-penetrating radars. The collective monography /
Editor . A.J. Grinev. - Moscow.: Radiotehnika. -
2005. – 416 p. (in Rus)
15.
Fullerton L.W. US Patent No. 7030806. April 18, 2006.
|

